We love stats. With so much data available to us on every aspect of marketing, we have come to trust stats with a level of awe and power that can sometimes lead us astray.
When someone releases a new research report or infographic, we eagerly cherry-pick the information to shore up our own opinions or challenge others. We’re so eager to trust cold numbers and make business decisions based on current trends that stats like these make their way into all manner of management pitches and marketing proposals.
But imagine if we behaved the same way in the doctor’s surgery? None of us would want to be prescribed medication based on the most common ailments suffered by the majority of other patients, no matter how many pie charts the doctor shows us. We want to be diagnosed based on our own blood tests and pathology results.
We’re told that numbers never lie. In fact they lie, obfuscate and mislead all the time, by omission at least.
What Numbers Don’t Tell You
Take this stat from last week as a “for instance”. (Hat tip to @globalcopywrite for alerting me to this one.)
Did you know? Question and fill-in-the blank posts generate about 90% more engagement.
@wildfireapp: March 20, 2013
Exciting stat. Plenty of retweets. The inference is we will see an improvement in our social media activity if we use more fill-in-the-blank posts. How easy! “Intern – be off with you to Twitter and get us some more of this valuable ‘engagement’ I keep hearing about!”
Doesn’t say whether that’s positive or negative engagement though, does it? Rather important when evaluating the stat as a business insight. Context is everything! Sometimes questions work really well. Nowt wrong with that. But it would be foolish to think the numbers aren’t skewed by those times when such posts have prompted a huge flurry of piss-take responses.
Anyone familiar with any of the major brand social media #fails over the last couple of years – and I mean big ones like Qantas, Coles and Woolworths – would know that a fill-in-the-blank post is an invitation to be trolled.
Of course it gets more engagement! You’ve just made it so temptingly easy for anyone to add a touch of irony or sarcasm to your words and use your brand as a piñata for the amusement of their followers! What japes!
Most social media marketers now shy away from the technique as way too risky. Sure, the engagement numbers would look amazing on the next monthly report, but the brand reputation risks taking a hit in ways the numbers probably won’t show. (Data and sentiment measures have trouble identifying sarcasm as well as context it seems.)
Don’t believe the hype!
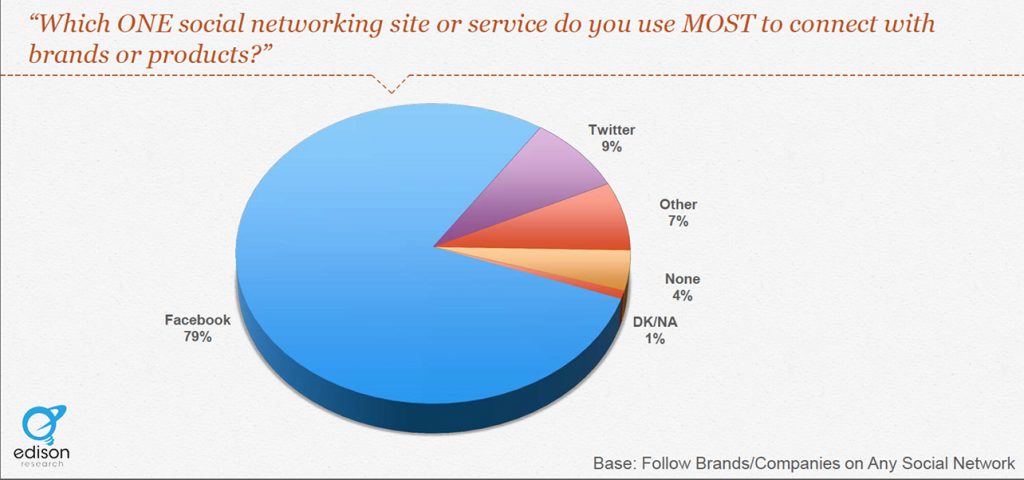
Here’s another fact, this time from the recent Edison Research report – The Social Habit 2012.

According to the report, one in three social media users now actively follow brands. 79 percent of those do so on Facebook. 47 percent also identified Facebook as the network with the most influence on their purchasing decisions, far ahead of any other network.
Wow again. Reading that report, any business not actively pursuing a Facebook strategy must be completely out of touch. How many proposals to management in the next few months are going to include those stats to justify the push for a Facebook page?
But Facebook is not right for every business. It doesn’t matter what everyone else is doing. It doesn’t matter how many people identify Facebook as having influenced their purchasing decisions cause you don’t know what those decisions were. Did they buy a soft drink or a new car?
I bet the numbers would be radically different if the questions were confined to how social media influenced the choice of corporate data centre or brand of toilet paper. Some decisions we just don’t make after visiting Facebook.
These stats are completely meaningless as business insights. All that matters is how your target audience behaves, no one else’s.
Conformity Sucks
What broad stats like these do is imply a normalcy or a trend too persuasive to ignore. If you know no better, it’s easy to assume the same stats should apply to you and your business. The stats imply that businesses taking this approach are succeeding and that going a different way risks failure. Or at least a harder road with a lot of unnecessary effort. You would do better to conform!
I was reminded of the irrelevance of supposedly convincing stats and ‘received wisdom’ when interviewing Phoebe Gazal of Papier d’Amour about their email marketing strategy for a recent article.
We were once told that Tuesday mornings were best for email. But our results told us that Friday afternoon was more successful.
Phoebe Gazal: Papier d’Amour
There are plenty of stats out there that claim to have the answer to what time and day of the week is best to send out your email newsletter. Or how many characters should be in your email subject line. But there is no single answer! It will always be unique to you and your particular scenario.
Stats like these may be a starting point to experiment, but nothing more. Determine your own metrics. Analyse your own data. The results you get are real, relevant and far more important in guiding future insights and activities.
